- /2
Your Automated Trade Log: Stop Guessing. Start Auditing.
Stop fighting spreadsheet formulas. Your trade log should analyze your behavior, not just store your fills.
A professional trade log is the difference between guessing and knowing. While a broker statement tells you what you traded, it doesn't tell you why or how well you executed. TradeBB transforms your raw import data into a structured trading diary—giving you a central place to rate your discipline, tag emotional mistakes like "FOMO," and review your P&L context without manual data entry.
The Automated Trade Tracker: See the Full Picture
Spreadsheets break. Links expire. Formulas fail. TradeBB provides a resilient, cloud-based trade log that standardizes every execution into a clean, sortable list. Whether you import via API or file upload, your history is organized instantly.
Normalized Data, Zero Maintenance
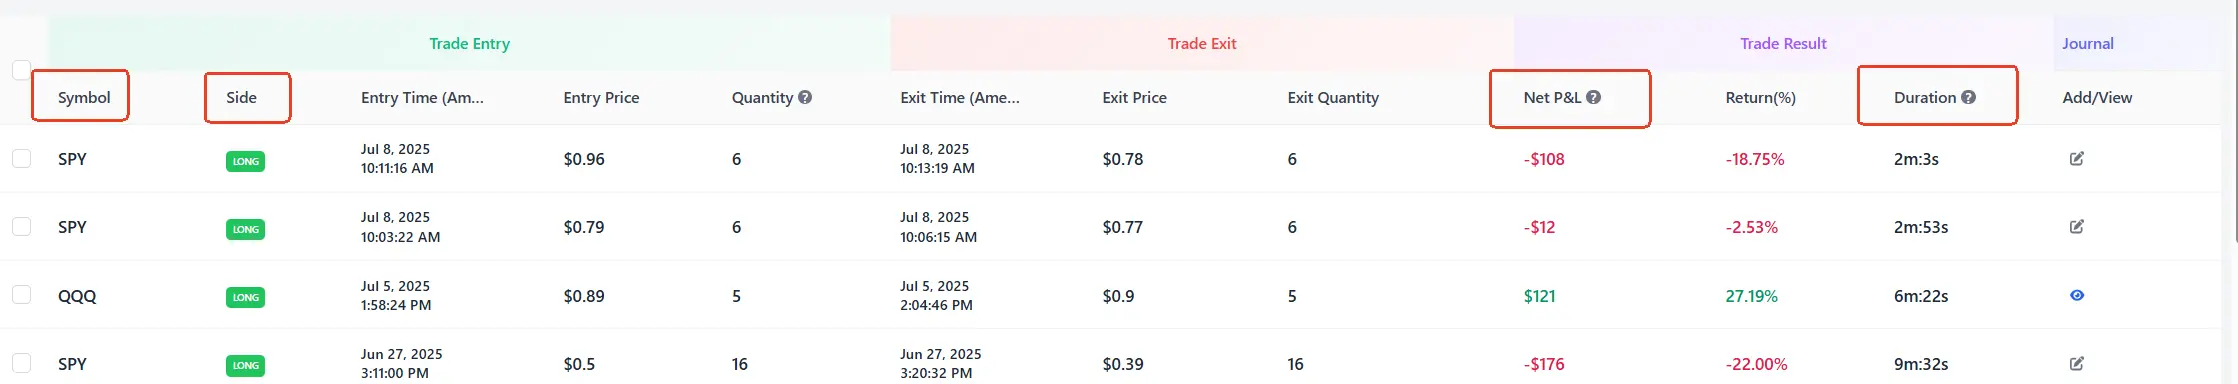
Your trade log automatically calculates metrics that brokers often hide.
- Duration: See exactly how long a trade was open (e.g., "3m:45s" vs. "4d:20h"). This helps you spot if you are drifting from "scalper" to "bag holder."
- Net P&L Status: Instantly identify winners and losers with color-coded tags.
- Side & Symbol: Filter your entire trade log by "Long," "Short," or specific tickers (like SPY or QQQ) to isolate performance by instrument.
Filter Noise, Find Signal
You can’t fix what you can’t find. Use the top filters to slice your trade log by date range, account, or specific tags. If you want to review only your "Red Days" or specific "Swing Trading" setups from last month, the list view updates instantly. This turns a static list into a dynamic trade tracker for your monthly review.
More Than a Log: It’s Your Trading Diary
Numbers show the result; the trading diary explains the cause. Clicking on any trade in your log opens the Detail View—a dedicated workspace for psychological and technical review.
Capture the "Why" Behind the Trade
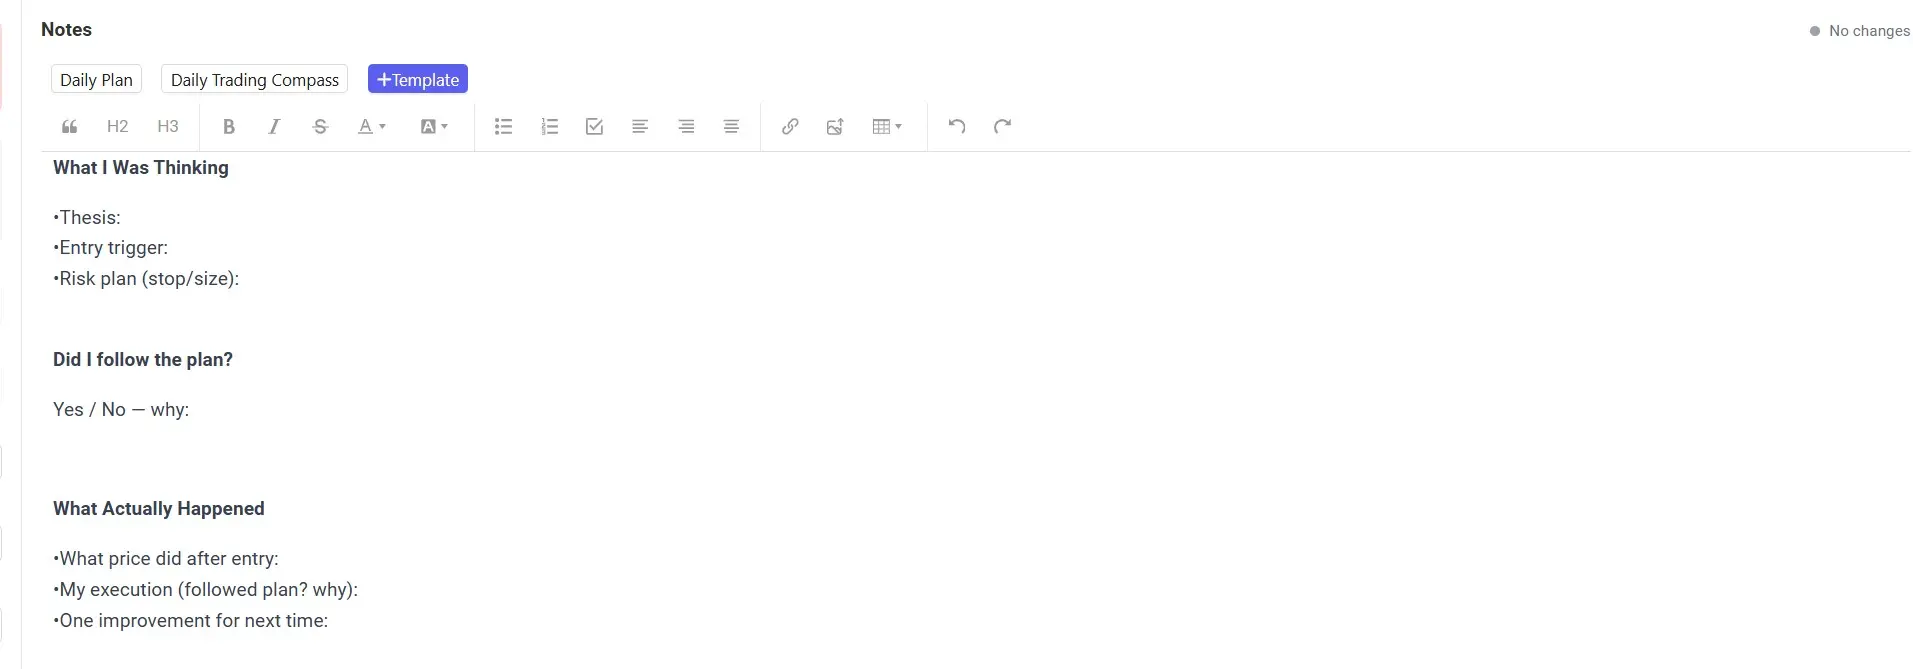
A trade log without context is just accounting. In the Detail View, you can document your mental state while the memory is fresh.
- Narrative Notes: Use the editor to answer critical questions: What was I thinking? Did I follow the plan?
- Custom Templates: Create a structured template for your trading diary entries so every review follows the same format (e.g., "Setup," "Trigger," "Mistake").
Tagging & Rating: Quantify Your Discipline
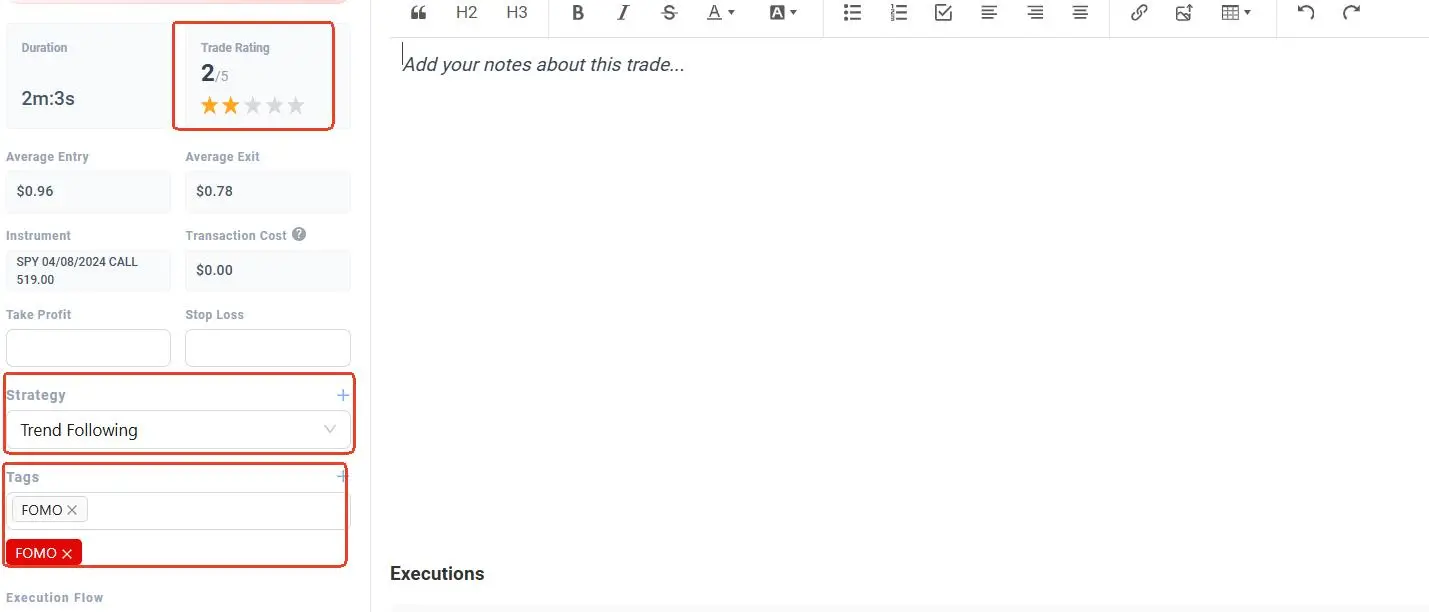
Was that loss bad luck, or bad execution?
- Execution Rating (1-5 Stars): Rate the quality of the trade, independent of the result. A losing trade that followed all rules deserves 5 stars; a winning "gamble" deserves 1 star.
- Behavioral Tags: Tag trades with "FOMO," "Revenge," or "Late Entry." Over time, you can filter your trade log by these tags to see exactly how much emotional trading costs you.
Deep Dive: Execution & Cost Analysis
Professional traders obsess over costs. Your trade log includes a granular breakdown of every partial fill and fee.
Transparency Down to the Tick
Verify your trade result with the Executions table. This section lists every individual fill that makes up the trade, including:
- Gross vs. Net: See how commissions and fees impact your bottom line.
- Entry/Exit Precision: Compare your planned entry price against the actual filled price to monitor slippage.
- Timestamp Validation: Ensure your trade log aligns with your broker’s official records to the second.
Strategy Attribution
Don't just log "SPY Calls." Assign a Strategy label (e.g., "Gap Fill," "Trend Following") to every entry. This allows you to categorize your trade log by setup type later, helping you identify which strategies are actually profitable and which ones are draining your capital.
FAQ
How do I get my data into the trade log?
You can import trades via our Integrations page. We support direct sync for many brokers and a universal "Any Broker" file upload for CSV/Excel exports. Once imported, your trade log populates automatically.
Can I edit the data in my trade log manually?
What is the difference between the Trade Log and the Dashboard?
The Dashboard shows aggregate metrics (Win Rate, Equity Curve) for the big picture. The trade log is for granular, trade-by-trade review, allowing you to drill down into specific executions and notes.
How does the "Duration" field help my trading?
Duration tracking helps you verify your style. If you claim to be a "scalper" but your trade log shows an average duration of 4 hours, you might be hesitating on exits. It brings objective reality to your self-assessment.
Is my trade log data private?
Yes. Your specific trade notes, psychological tags, and P&L data are private to your account. We do not sell your personal trade log data.